This lab integrates IMU sensor data into the bluetooth data reporting infrastructure
After downloading the ICM 20948 library in the Arduino IDE, connecting up the IMU, and opening the Lecture 4 demo code, I could retrieve IMU data. This is what my setup looked like:
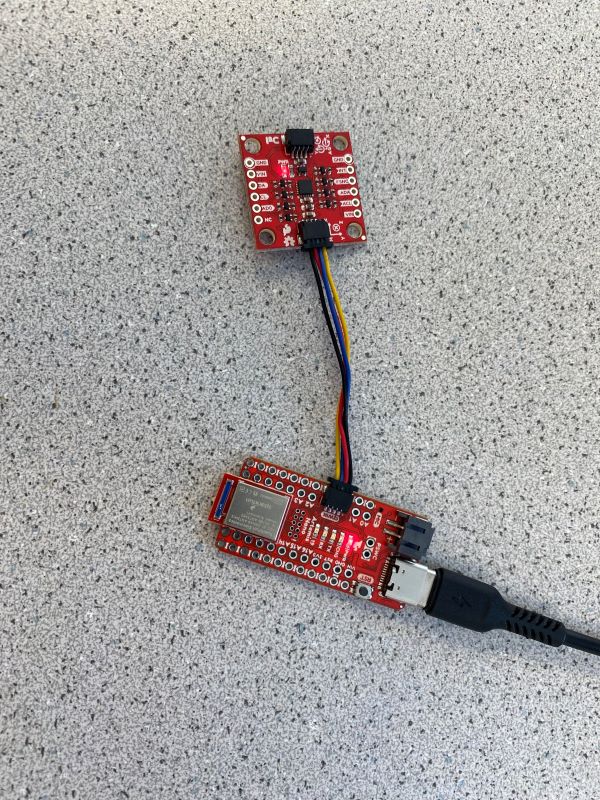
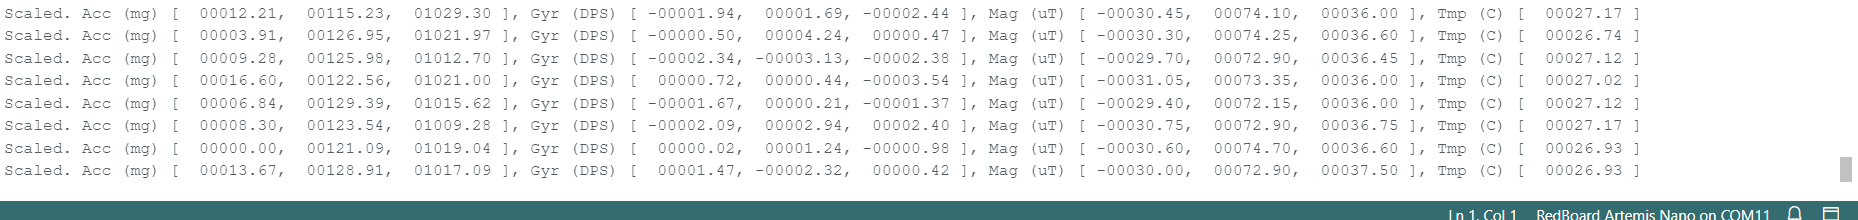
By opening up the serial monitor, I can view the stream of data coming in from the IMU though the Artemis board.
I have set up my IMU to communicate with the Artemis over I2C, which requires each peripheral to have an address. The IMU has a default I2C address of 0bxxxxxx1, and if I short the ADR jumper pads on the back of the IMU, I can set the I2C address to be 0bxxxxxx0. Basically, this determines what the last bit of the IMU's I2C address is. According to Sparkfun's website, the full I2C address is 0x69 normally, and 0x68 with the jumper, which is consistent with AD0_val's behavior.
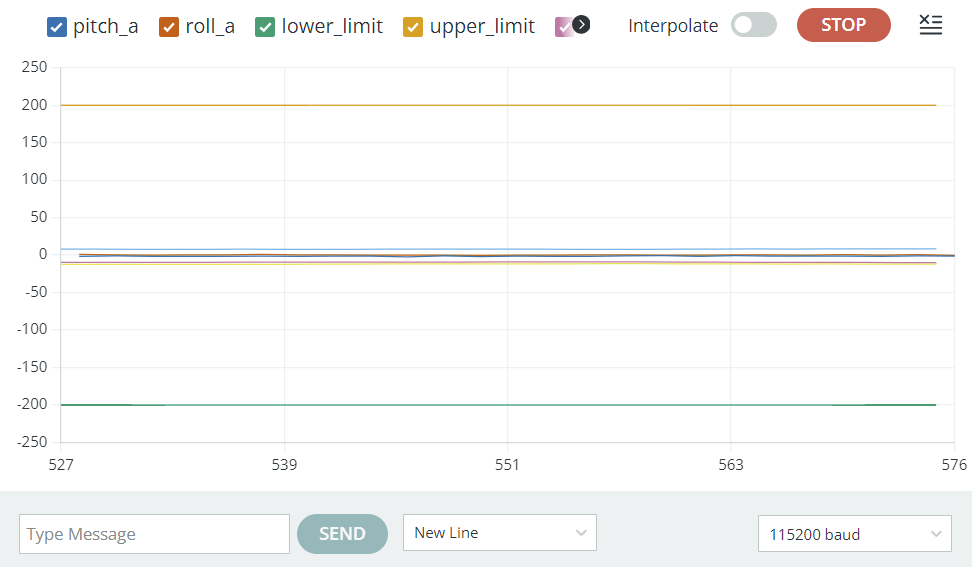
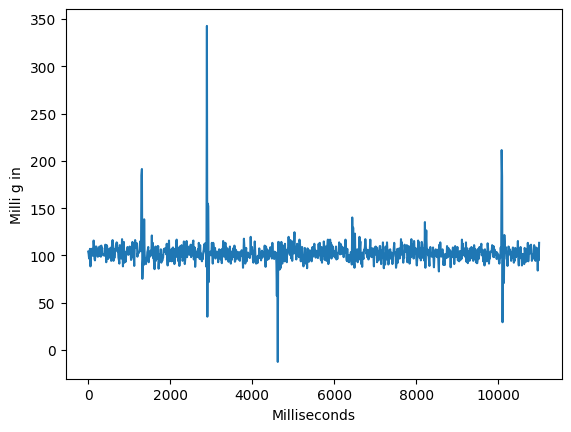
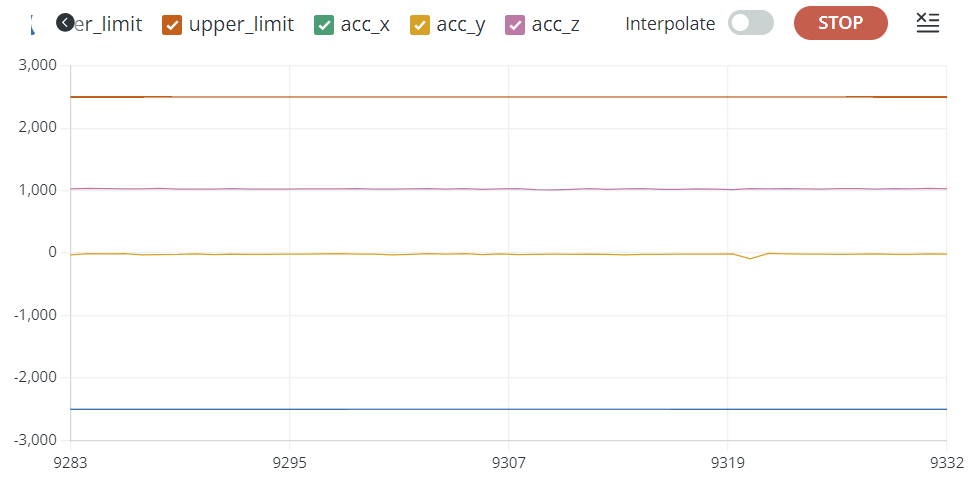
The acceleration data is reported in units of milli-g. When I hold the accelerometer flat against the table, the x and y axes read zero acceleration, and the z-axis reads 1000 milli-g of acceleration, which is consistent with what I expect, as the acceleration of gravity is acting on the MEMS sensor.
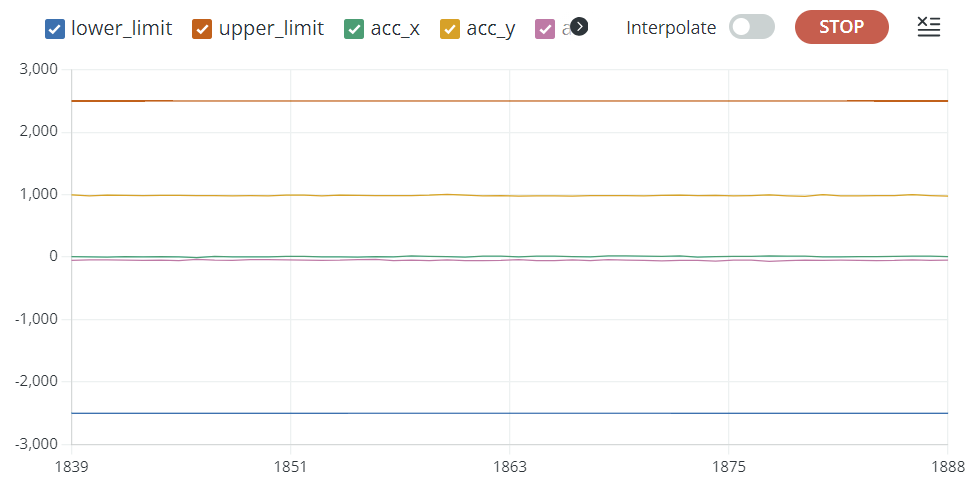
When I rotate the IMU, the x and y axes change, and the z-axis decreases. If I put the IMU on its side, the y-axis goes to 1000 and the other axes go to 0. This means that the y-axis of the IMU is pointing downwards (the direction of gravity's acceleration).
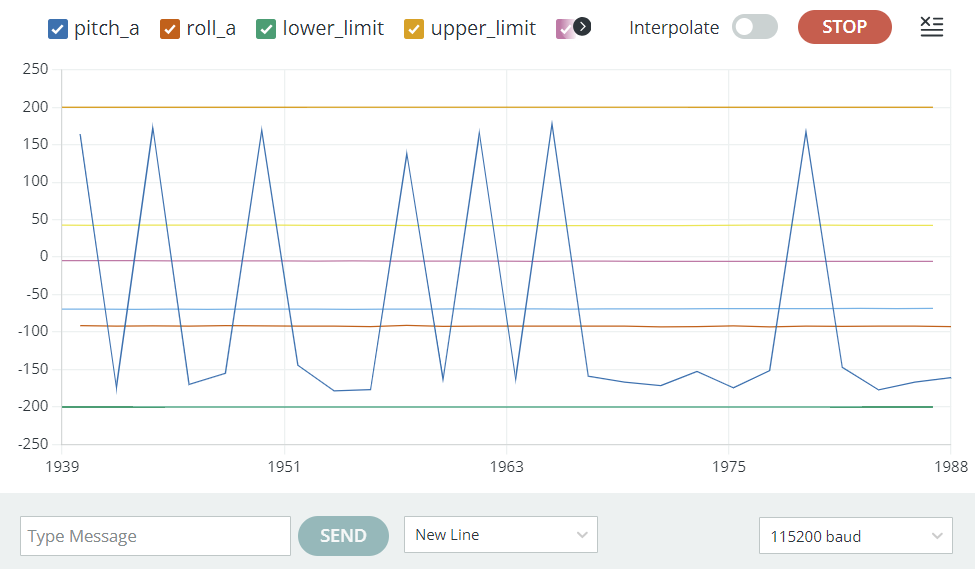
To validate gyro data, I rotated the IMU along the x axis. As I rotate along the right hand rule, the pitch angle is positive, and as I go the other way, the pitch angle is negative. This is consistent with expectations.
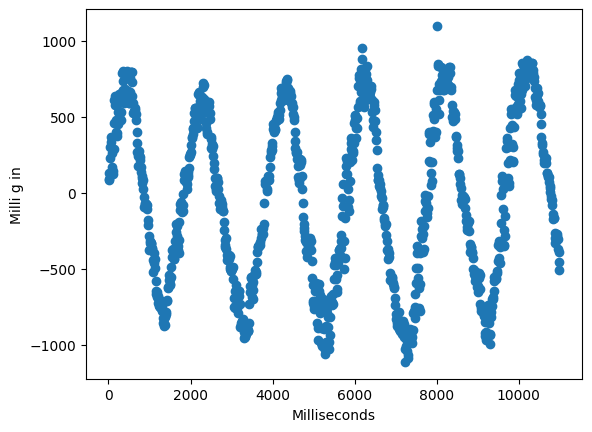
One issue with gryoscope data is that it has drift. The IMU chip reports angular velocity in degrees per second, and I'm integrating that over time to get the angle. The data has low noise but high drift due to this integral.
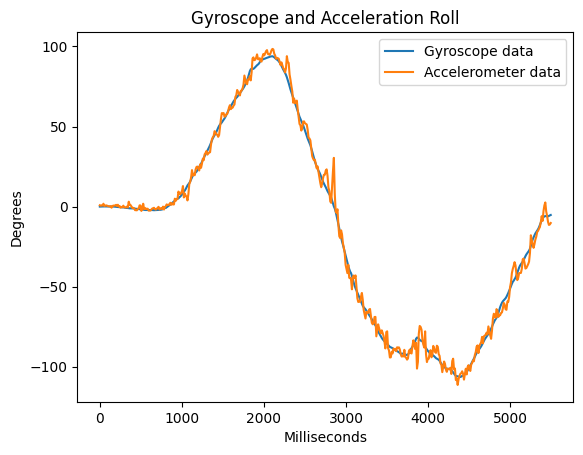
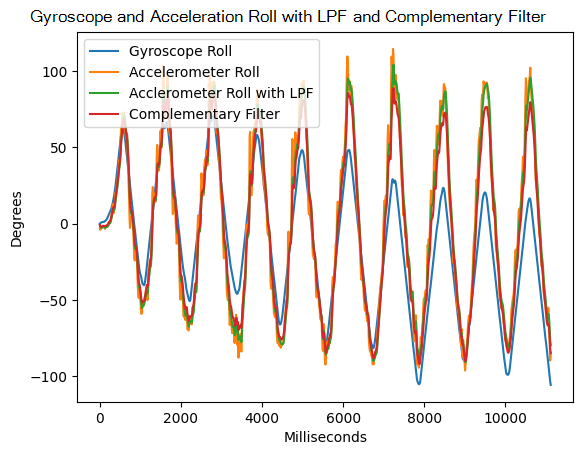
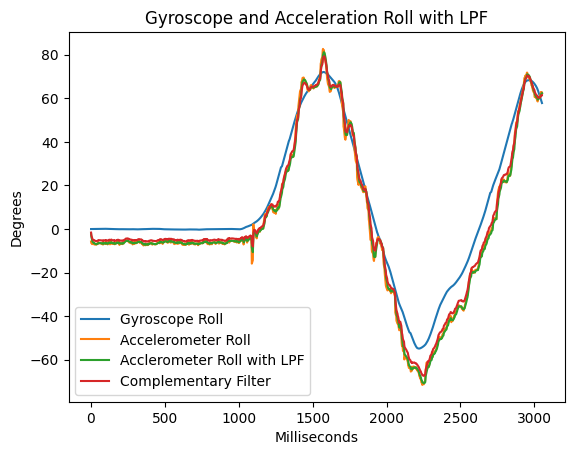
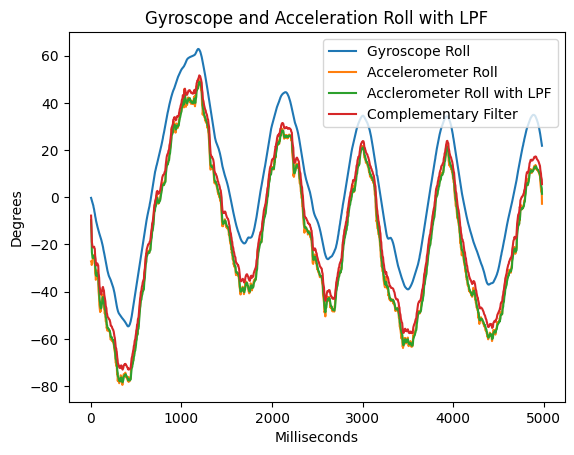
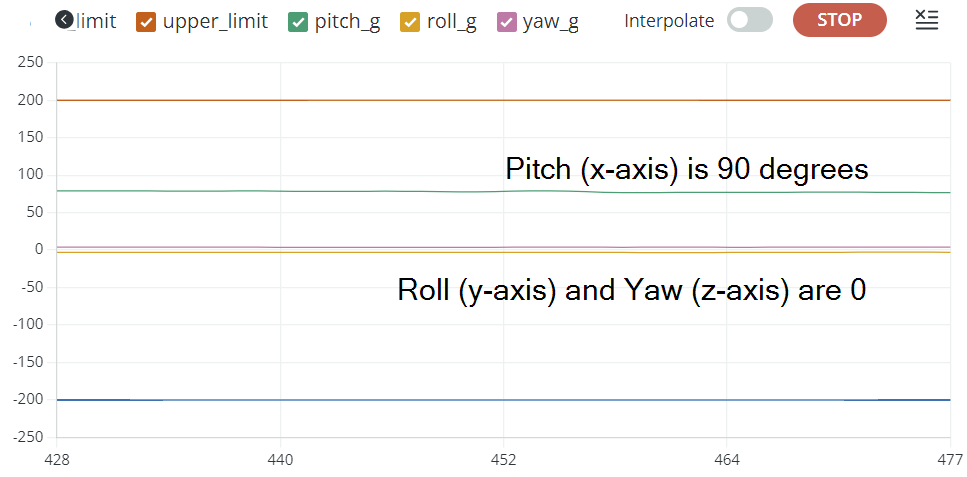
To prevent this drift, I can use atan2() with the accelerometer data to report a driftless measurement of pitch and roll. This idea takes advantage of that fact that on Earth, we constantly have an acceleration vector of length 1 g pointing downwards. By evaluating the components of the gravity vector along the x and y axes, we can get an absolute measurement of pitch and yaw. Unfortunately, since the yaw axis points along the gravity vector, we cannot determine yaw with this method.
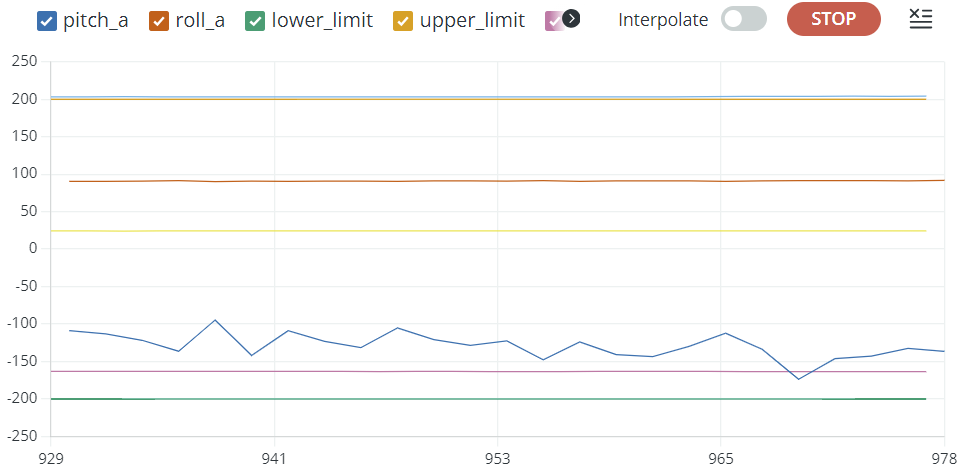
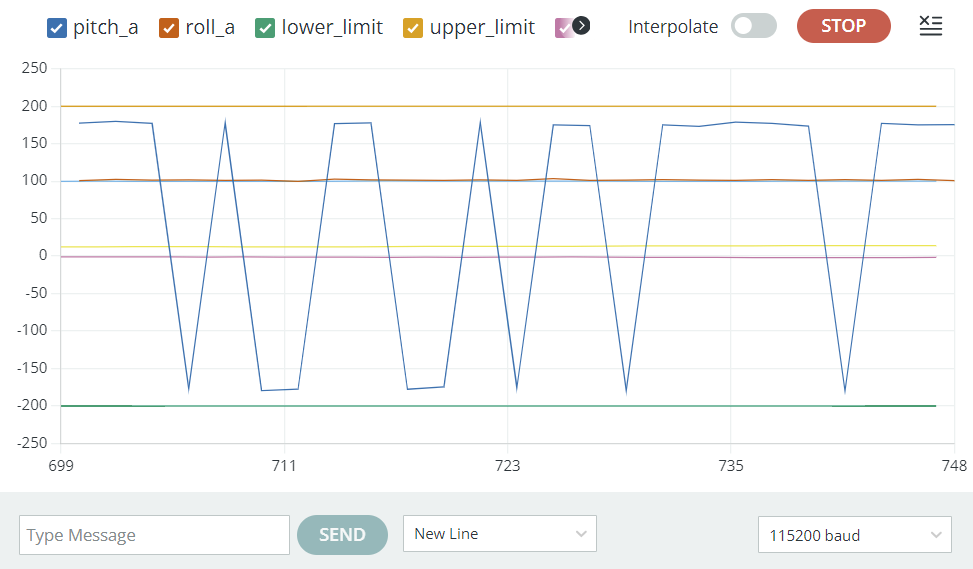
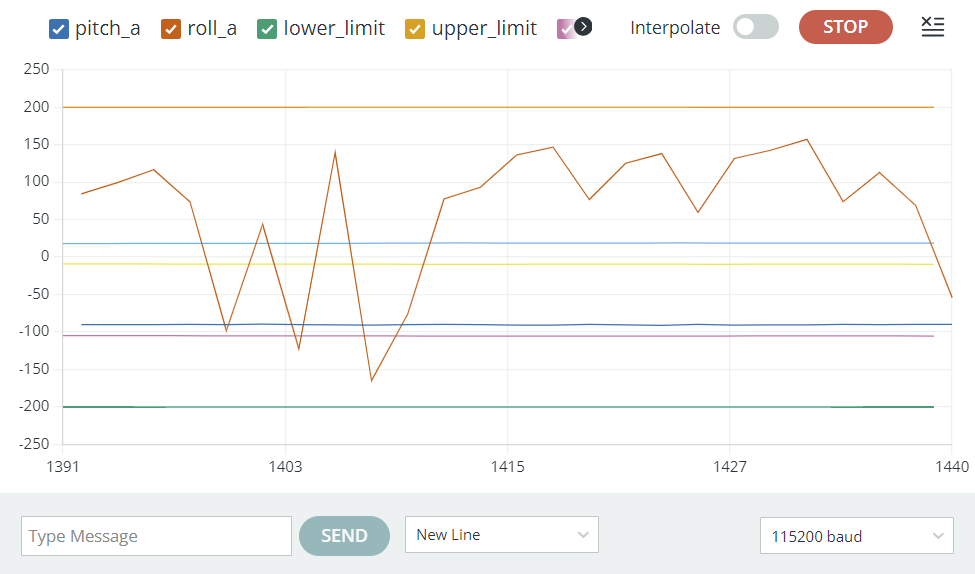
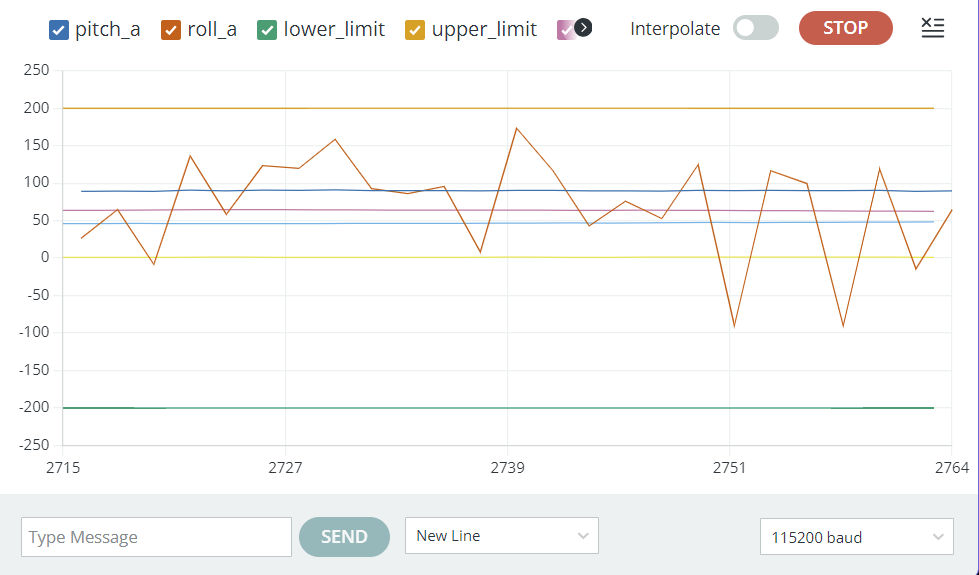
You can see that the roll data from both the accelerometer and gyroscope agree at 90 degrees. However, if I move the IMU around, the gyroscope will eventually diverge from the accelerometer data.
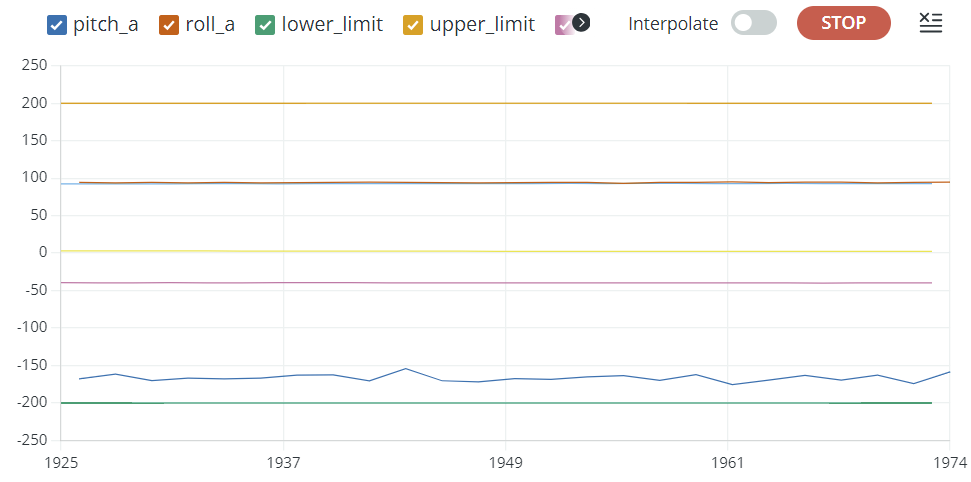
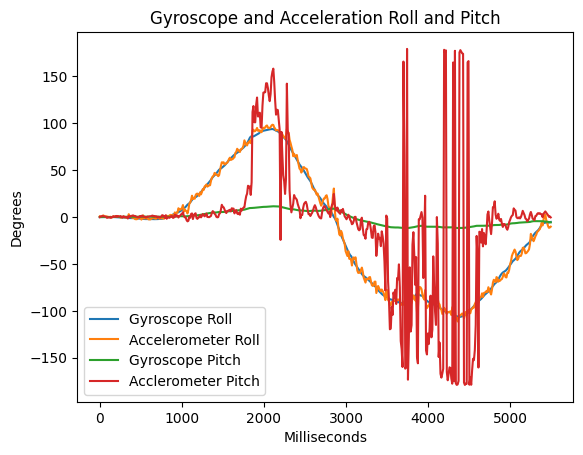
The drawback of using the accelerometer to measure pitch and roll is that noise increases severely near 90 degrees. This is a result of atan2 being poorly conditioned around accel_z = 0. If I expect the car to need pitch and roll measurements near 90 degrees, I would not use this data in that operating condition. You can see in the below picture how noisy pitch_a gets here.
After downloading the ICM 20948 library in the Arduino IDE, connecting up the IMU, and opening the Lecture 4 demo code, I could retrieve IMU data. This is what my setup looked like:
By using the fact that the accelerometer is always sensing a 1 g acceleration straight downward (gravity), we can measure roll and pitch with a separate method from the gyroscope. The accelerometer data is driftless, but has some pretty severe noise issues.
A 0 degrees roll and 0 degrees pitch, the accelerometer data is quite good. However, because atan2 becomes poorly conditioned when either the x or y component approaches 90 degrees, we can get really noisy data around there.
Graph of 0 degrees roll and 0 degrees pitch:
Graph of -90 degrees roll and 0 degrees pitch. The accelerometer roll measurement is accurate, and the gyroscope roll measurement has drift, but both are okay. However, the accelerometer pitch measurement is all over the place.
Graph of 90 degrees roll and 0 degrees pitch. Results are similar to the previous case
Graph of 0 degrees roll and -90 degrees pitch. Here, the accelerometer pitch is accurate, and the gyroscope measurement has drift, but both are fairly acceptable. But now that our pitch measurement is good, the roll measurement from the accelerometer is super noisy and jumping between -180 and 180 degrees.
Graph of 0 degrees roll and 90 degrees pitch. These results are similar to the previous experiment.
We can do a two-point calibration to create a corrected value of the sensor in case it has some error. When I orient the accelerometer where the y-axis points straight down, the accelerometer reports a value of 990 milli g. When I orient the accelerometer so that the y-axis is pointing straight up, the accelerometer reports 1015 milli g. Online it says that gravity fluctuates around different parts of the Earth, and according to a geographic gravity calculator, 1 g is 9.803 m/s^2.
Assuming the accelerometer uses 9.81 m/s^2 as a reference value, 990 milli g = 9.712 m/s^2 and 1015 milli g = 9.957 m/s^2. The formula to get a corrected value from a two-point calibration is:
CorrectedValue = (((RawHigh - RawLow) * ReferenceRange) / RawRange) + ReferenceLow.
RawHigh = 9.712 m/s^2
RawLow = -9.957 m/s^2
ReferenceRange = 9.803 * 2 m/s^2
RawRange = 9.712 + 9.957 m/s^2
ReferenceLow = -9.803 m/s^2
So, my corrected value is 9.803 m/s^2. This means that I've created a reference around 1 g, and if I use this formula for my measurements from now on, anything around this 1 g value will be much more accurate.
Overall, the data from the accelerometer is very accurate and has low noise. I still wouldn't use it for dead reckoning, but it would be a great addition to a Kalman filter in the coming weeks.
If I rotate the accelerometer at a slow rate back and forth, I can introduce a signal, and by doing a Fourier Transform on my output, I can measure how much noise was introduced. I'm assuming that my hand can only introduce low frequency content into the the sensor, so I'll consider any high frequency content as noise. The purpose here is to find what the threshold for "high frequency content" should be.
Here is the signal I put into the IMU:
After running the Fourier transform and turning discrete frequency into time-based frequency, I get the following:
Looking at the data, I see my signal input at low freuqency. Then I see some noise or vibration from my hand, a spike at 10 Hz, and then it drops off after that. Do I'm going to choose 8 Hz as my cutoff frequency to tune out whatever is causing that 10 Hz spike. I'm making a first-order low pass filter, so that means the output drops off at a rate of -20 dB per decade after the cutoff frequency. This means the 10 Hz spike will be quite severely attenuated, and anything after that will be negligible.
There is some noise on my signal. I wouldn't call it negligible. However, I would consider my overall SNR to be quite good. The noise has a thermal component, so higher operating temperatures would cause more noise, and also an EMI component, so operating the IMU near a motor would also mess with readings. The chip itself is already set to a low-noise mode, so that also explains why the data is quite stable.
I tried tapping slowly on the table, but I didn't see any interesting frequency content in the signal. It seems my noise floor is around 50 dB. Here's the time-domain plot of me tapping on the table:
And here is the frequency domain. You can see a spike at DC because the chip isn't lying fully flat on the table and I'm measuring the x axis here.
Since the frequency content of this signal is pretty evenly spread out, this is a good signal to test a low-pass filter. If I choose fc = 8, I can use the period between my samples to calculate an alpha of 0.355.
Applying this LPF to my data yields this unintelligible fourier transform:
However, after applying a rolling average to the fourier transform, a linear decrease appears around log10(8 Hz) = 0.9!
Even though I'm not measuring over a large range of frequencies, this shows that my low pass filter works as intended.
I can get roll and pitch data from both my gyroscope and my accelerometer, but both data sources have tradeoffs. For example, my gyroscope data has drift, but low noise, and my accelerometer data has noise but no drift. Here's a plot of my gyroscope and accelerometer data for roll:
This seems great, but while my roll is near 90, my pitch from my accelerometer is completely unusable.
I worry about this issue later when I create a complementary filter.
Anyways, I can solve part of the noisy data from the accelerometer by adding a low pass filter with a cutoff frequency of 8 Hz, using results from my earlier filter tuning.
If I reduce my sampling rate, the drift doesn't significantly increase with a simple sine wave, but I can imagine it would increase my drift a ton since I can't capture my motion as well. Changing the sampling frequency does affect the low pass filter, however, and I'm seeing it affect my data since the LPF is invariant on discrete time, not actual time.
Coming back to the complementary filter, I have two data streams that I want to combine, and I want something that has slightly more fidelity than an average of the two data sources. So the complementary filter allows me to put weights on my average. With a theta = 0.8 and depending primarily on acceleration data, I get a smooth, driftless value:
If I get rid of my delay that I put in my data acquisition loop, I get 1000 samples in 3.1 seconds. In other words, I have a sampling rate of 1000/3.1 = 322 Hz. With optimization of the Artemis code, however, I could get higher sampling rates. Each data reading is different from the last, so I'm not reading faster than my sensor can provide data, yet.
It more modular and easier to add and remove things when you store separate arrays in the short run. In the long run, you could make one large array and have your "send to PC" function smartly load data based on some enumeration or something, but that's just a quality of life upgrade for the programmer, not an optimization for runtime. Storing data in multiple or one big array also takes up the same amount of memory. So, for the ease of development, I believe that storing accelerometer and gyroscope data in separate arrays is the better choice.
As I've worked with bigger and bigger data, I have thought about rewriting BLE to use integers and floats instead of strings, because strings are really memory-inefficient for storing numbers. A float with 5 digits and a period takes 24 bytes to store, as opposed to four bytes for the float and one byte perhaps for some null character. Most of the math that I do on this microcontroller doesn't need double. In fact, I think I don't even need floats and could get away with fixed-point arithmetic. So, as long as it's not Strings or doubles, I'm fine with either data type between floats and ints.
The Artemis Nano has 384 kB of RAM. If my program takes up 17% of that, then that leaves me with around 310 kB of memory to use at runtime. Assuming 9 tables of some four-byte datatype (ints or floats), that leaves me with a little over 8000 as the length of my data arrays. That's actually less data than I anticipated. This is like 25 seconds of data at the full measuring rate.
To collect 5 seconds worth of data, all I need to do is increase my array size and flag my data collection loop to stop after 5 seconds. The issue I ran into here is maintaining a stable connection over such a long period of time. At least that's what I think it is. Anyway, here's some data for 5 seconds. It's about 1600 data points and there are another four registers for all pitch data that I haven't plotted.
I spent some time playing with the RC car and got it to do a few flips. With more battery, I think you could flip just by decelerating hard at high speed, but I did it against some walls.